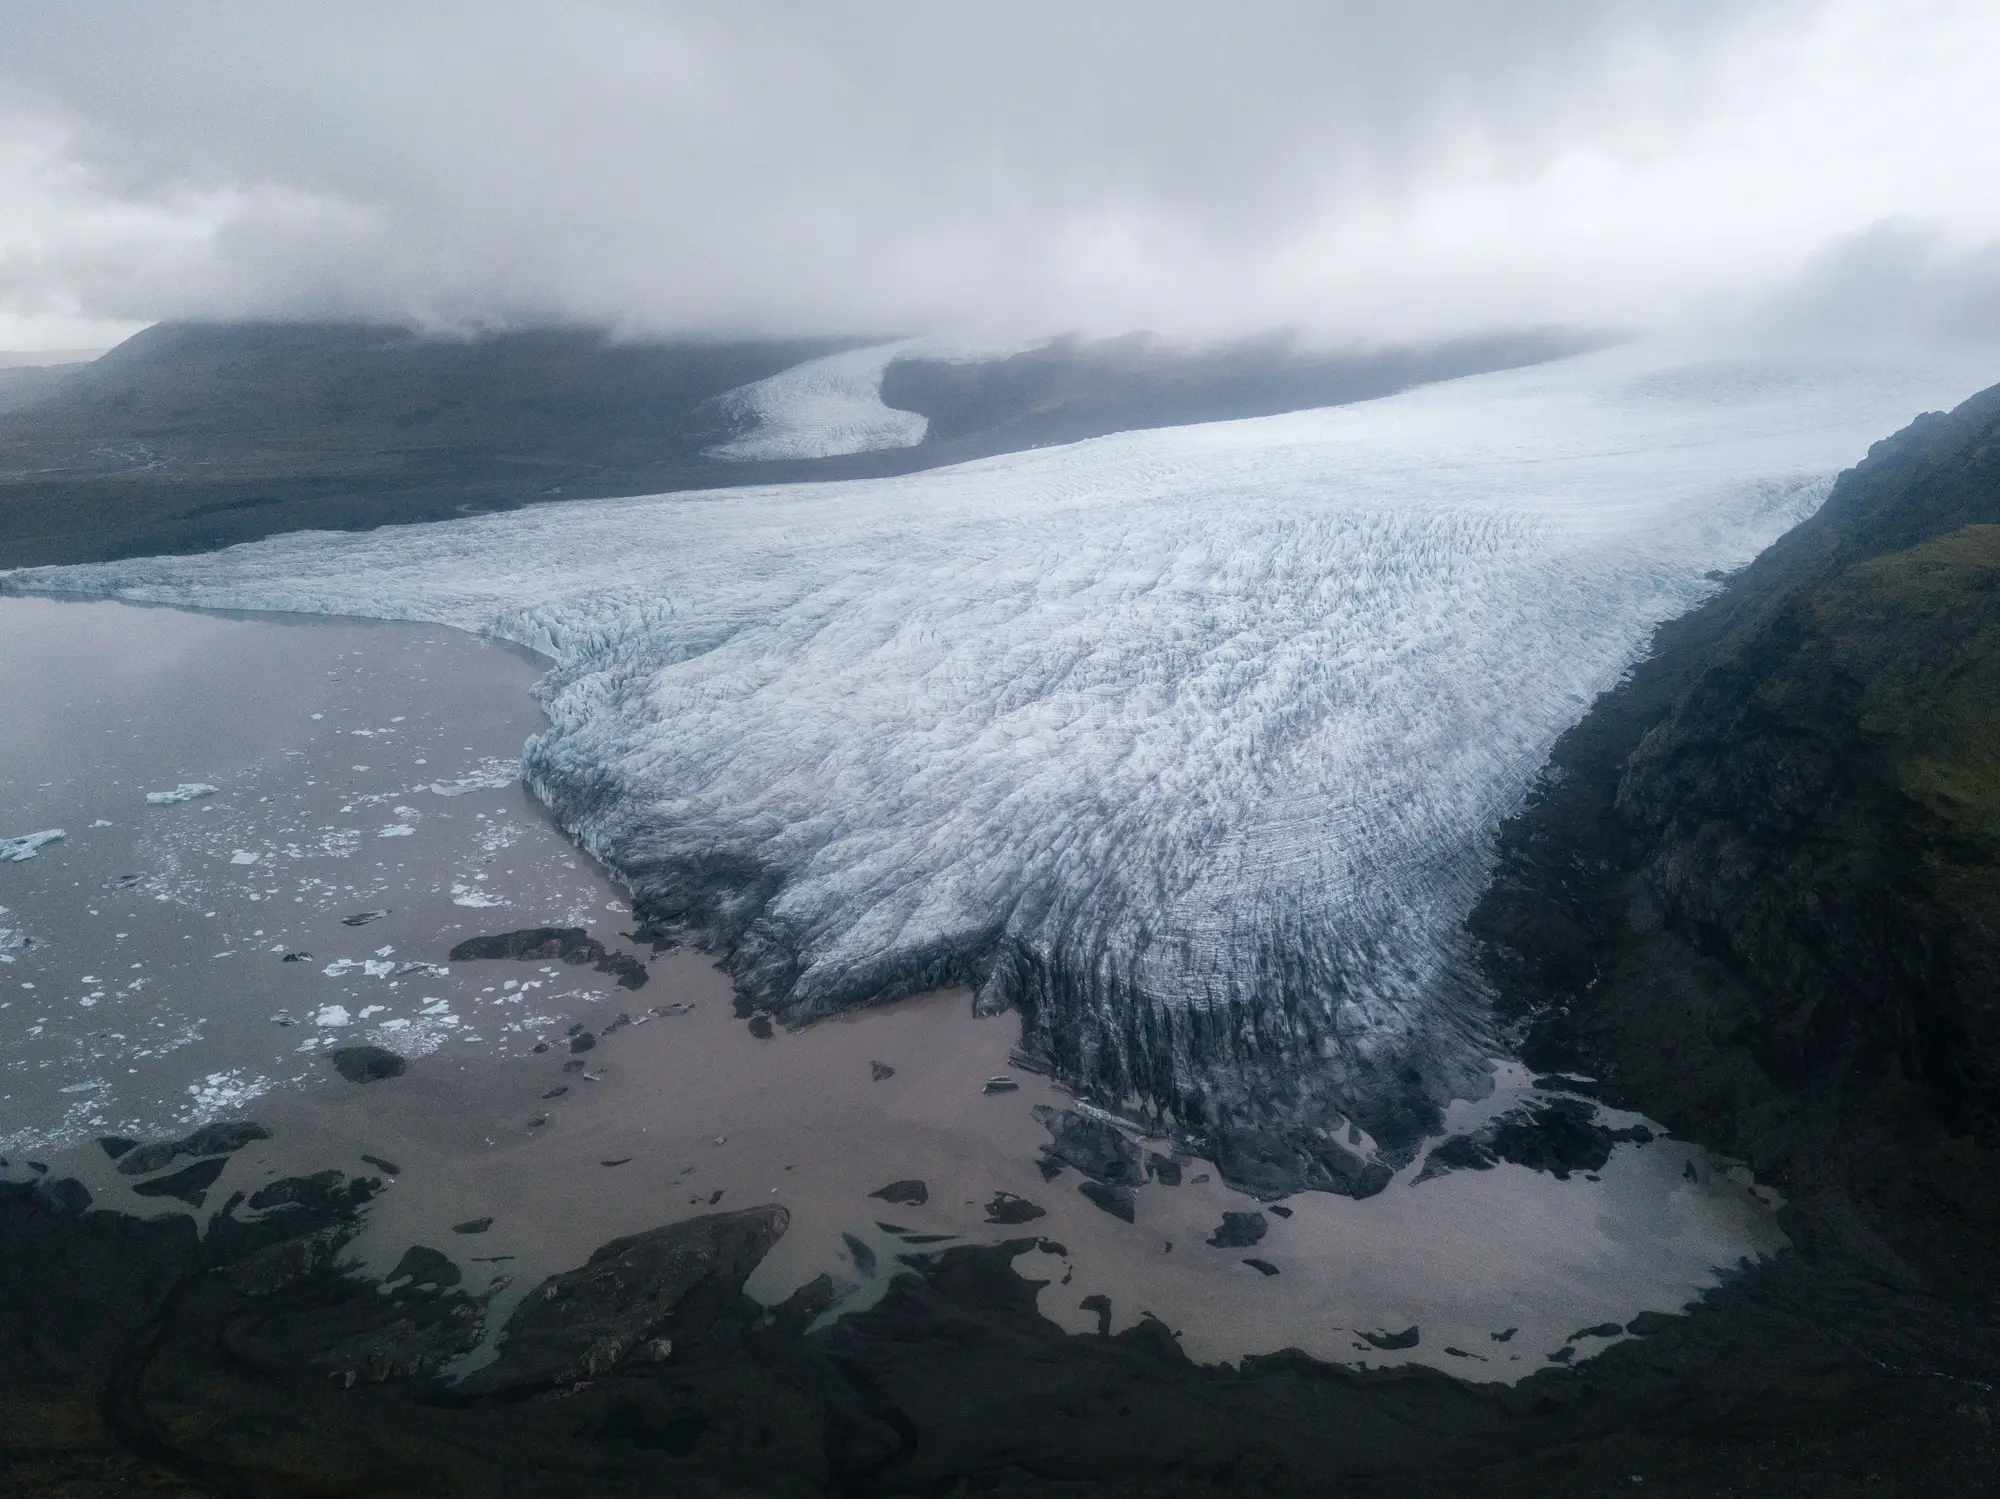
Basin extent · seasonal
Track how far the ice has pulled back, season by season.
Extent maps for the glaciers that feed your catchment, built from a multi-decade optical satellite archive.
Extent maps for the glaciers that feed your catchment, built from a multi-decade optical satellite archive.
You run the long-range supply plan for a river that starts under ice. Most of the year the glaciers barely matter to it. In a dry August they can be most of what reaches the intake, and that is the month the board asks about.
The glacier area in your runoff model probably comes from an inventory outline traced from imagery that is fifteen or twenty years old. Newer numbers sit in a university paper covering the next range over, or in a consultant's report that stopped the year it was paid for. Commissioning a proper remote-sensing study of your own basin means a scope, a procurement round and a season of waiting, so the old outline stays in the model for another planning cycle.
Meanwhile the snout has moved back up the valley and nobody on staff can say by how much.
One season's extent is a snapshot. Line up every season with clear imagery and you get the retreat curve.
The back record is delivered once, at the start. After that you get a new season each year once the ablation season closes and a clear scene is available.
One polygon set per season for every glacier in the catchment, mapped from the clearest late-ablation-season scene. Each season carries the acquisition date of the scene it came from, so you know exactly which day the outline shows.
Where the snowline is visible at the end of the melt season, it is traced as its own layer. Intersect it with your DEM and you have the usual optical proxy for the equilibrium line altitude.
Mapped area by season, per glacier where individual glaciers can be separated, as far back as the archive covers your site. Seasons without a usable scene are left as gaps, never filled in.
A short write-up of the change in mapped ice area across the record, with the scene list and the gaps stated. Written to go straight into an appendix of a hydrology or climate report.
A catchment boundary as a shapefile or GeoPackage, or just the glacier IDs from your inventory. Tell us which years matter to your plan.
Before any mapping, we look at how many seasons have usable cloud-free imagery for your site and tell you what record you can expect.
The clearest wide-swath multispectral scene from each season is chosen, and ice and snow are segmented in it. The seasons are then lined up into one record.
Extent layers, snowline, time series and summary for the whole record, in formats that open in QGIS or ArcGIS.
Each year, after the melt season, the new season is added to the same record.
A measured retreat trend to set against your long-range meltwater contribution estimates, and to argue about peak water with numbers.
A current glacierised area for the model instead of an outline from an old inventory, updated each season.
A basin-level figure with the scene dates behind it, for the adaptation or climate report your agency files.
A recent extent layer to plan survey visits and stake network changes around.
These are the ways a satellite extent record can mislead you. Each one is stated in the basin summary too.
No. Surface extent only: no mass balance, no thickness.
Back to the earliest usable cloud-free optical imagery of your site. That varies a lot from place to place, so it gets checked for your basin before any work is agreed.
Yes. Each season uses the clearest pass in its window, and a very cloudy season may not have a usable one. Missing seasons stay missing in the time series.
No. It reports extent that was actually observed. If your runoff model projects melt, this can give it a current glacier area to start from.
10–30 m GSD. Anything at the ice margin smaller than that won't show up.
Every outline carries its scene date, so you can compare it with a terminus GPS survey, stake positions or photos from a field visit in the same season. Tell us where your ground truth is when the basin is scoped and it can be set side by side in the summary.
The outlines are mapped fresh from imagery, so they will differ from an older inventory outline, which is the point. Where you want per-glacier figures, your inventory's glacier IDs can be carried over so the two line up.
Use and ownership terms for the delivered layers are written into the contract before work starts. The public satellite archives the maps come from keep their own licences.
Each basin is scoped and quoted on its own: catchment area, number of glaciers, years of back record and how many seasons you want going forward. You get a written scope you can take through your agency's procurement.