Field notes
Accumulation area ratio explained: reading a glacier's health from its snowline
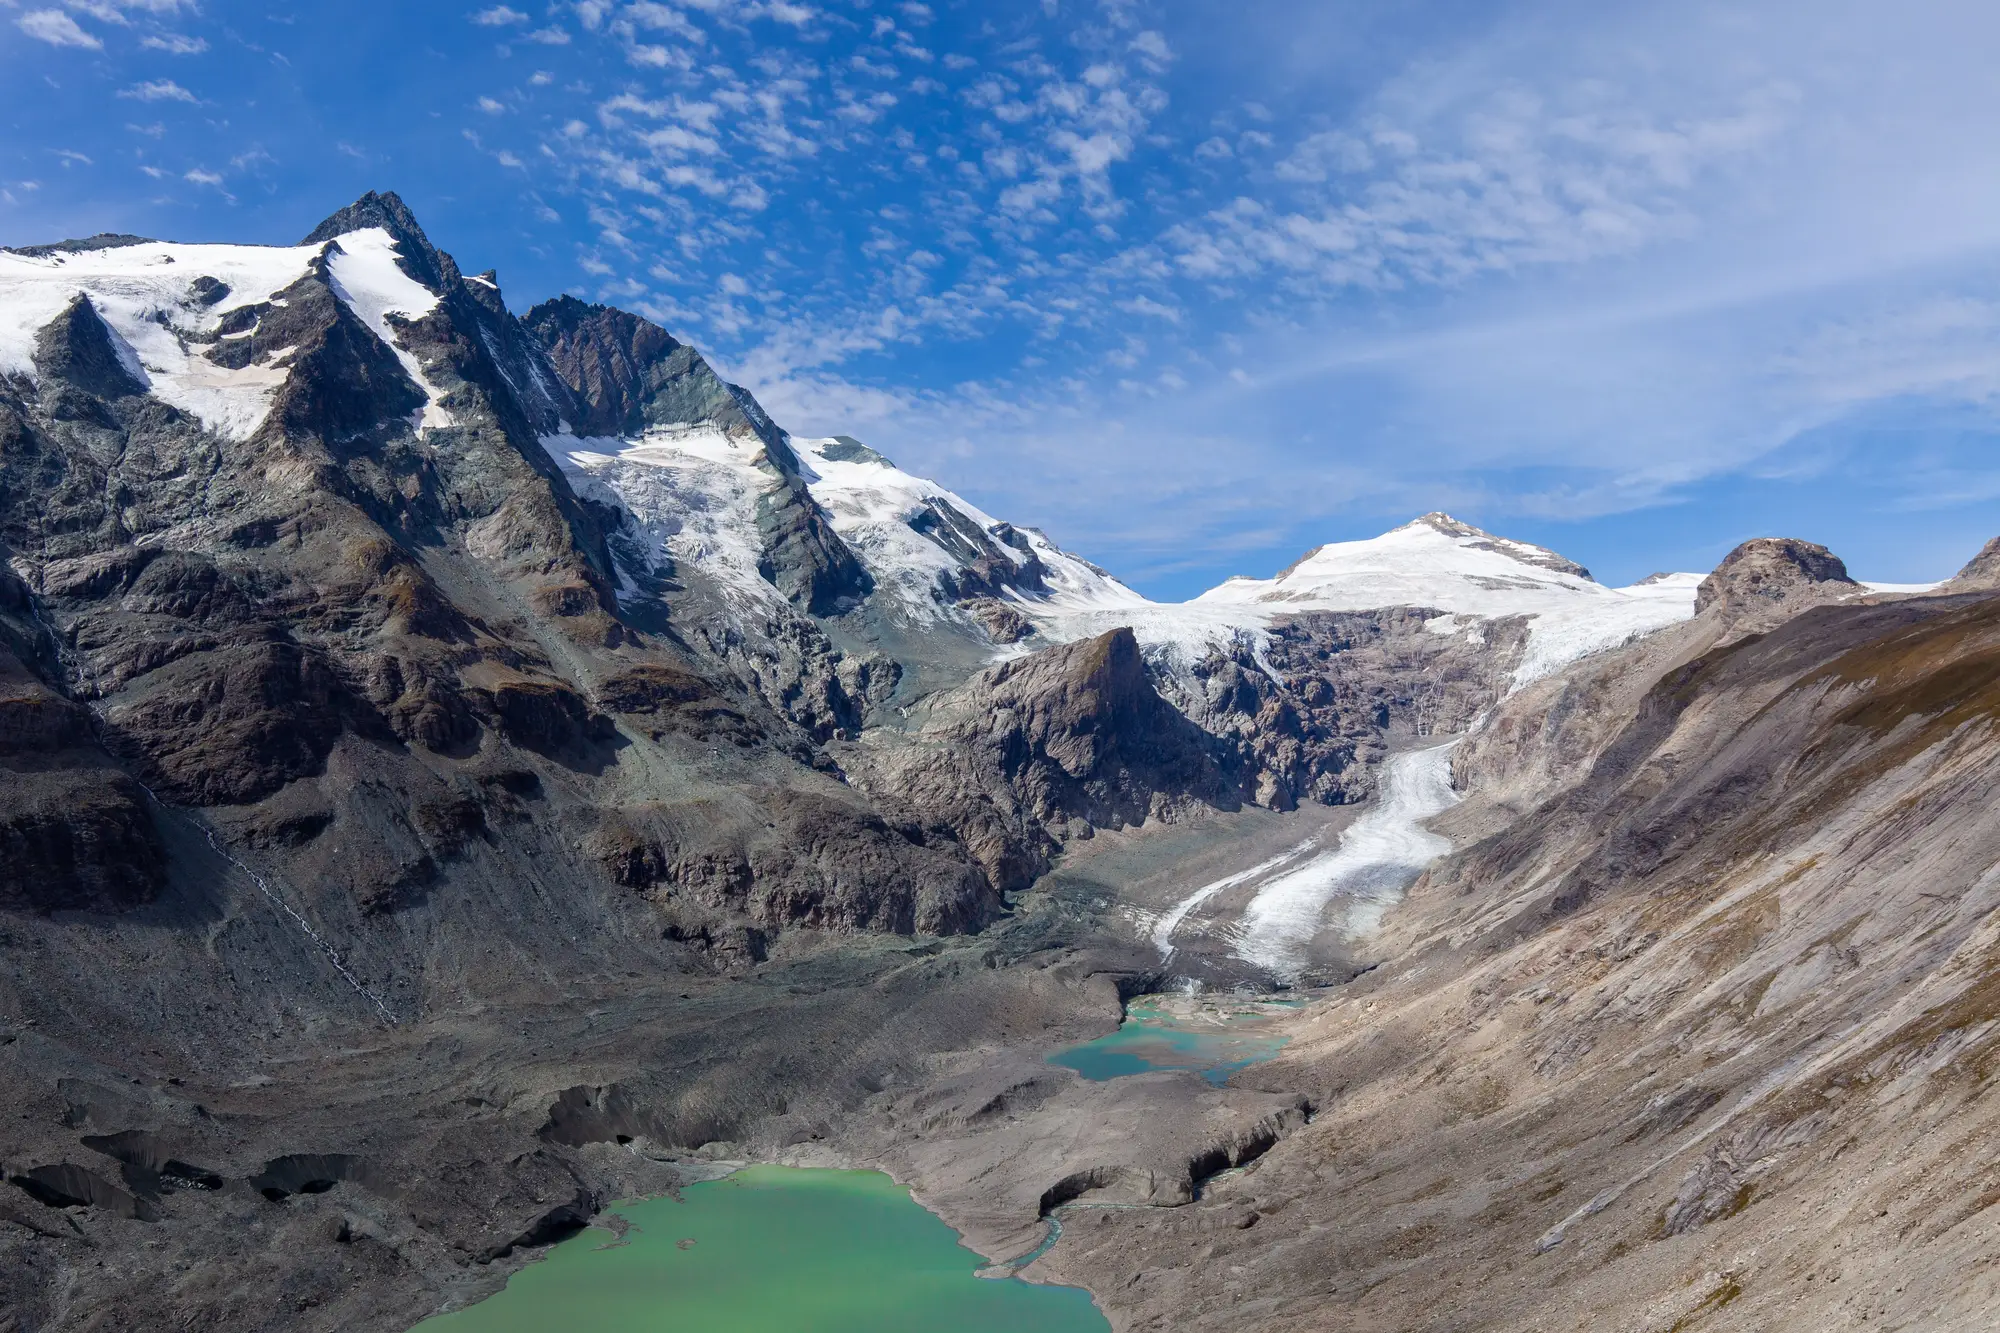
The accumulation area ratio is just the fraction of a glacier that's still covered in snow at the end of the melt season, divided by the glacier's total area. A glacier with an AAR of 0.6 at the close of summer has 60 percent of its surface still holding last winter's snow. The other 40 percent, below the snowline, is bare ice that's been losing mass all season. That boundary between the two is the firn line, and where it sits on the glacier each year tells you more about the glacier's trajectory than almost any other single number you can pull from a satellite pass.
Accumulation zone vs ablation zone
Every glacier has two working halves. The accumulation zone is the upper section where snowfall exceeds melt over the year, the part that's building mass. The ablation zone is everything below that, where melt wins and the glacier is losing mass to runoff. The line between them, the firn line or snowline, moves up and down the glacier from year to year depending on winter snowpack and summer temperatures. In a cold, snowy year it sits lower on the glacier, meaning more of the surface stayed in the accumulation zone. In a hot, dry year it climbs, shrinking the accumulation zone and expanding bare ice.
AAR is just a way of putting a number on where that line landed relative to the glacier's total footprint. It's measured at the end of the ablation season, typically late summer in the Northern Hemisphere, when the seasonal snowpack has melted back as far as it's going to for the year and what's left on the upper glacier is the true accumulation area.
Why AAR is used as a glacier health indicator
A glacier in mass balance equilibrium (one that's neither gaining nor losing mass over the long run) tends to sit at a characteristic AAR, often cited in the glaciology literature somewhere in the 0.5 to 0.8 range depending on the glacier's shape and local climate. That steady-state value is sometimes called AAR0. When a glacier's AAR consistently runs below that steady-state value year after year, more of its surface is in the ablation zone than its geometry can sustain, and it's losing mass overall. Track that ratio over a decade or two and you've got a trend line, not just a snapshot.
That's the appeal for anyone managing a catchment downstream. You don't need a full geodetic mass balance survey with stakes drilled into the ice to get a usable signal. A clean end-of-summer image showing where the snowline sat, compared against the glacier's known area, gets you most of the way there. It's a coarser measurement than direct mass balance, but it's one you can reconstruct from archival imagery going back decades, which stake networks and field campaigns almost never cover.
Pulling AAR from a seasonal record
The practical catch is getting a clean, cloud-free, late-season image at the right moment for every glacier in a basin, every year, going back far enough to see a trend rather than noise. One bad snow year or one early autumn snowfall captured mid-image and the ratio for that season is junk. That's the part that usually keeps this kind of record out of reach for a water agency without its own remote-sensing staff: not the concept, the archive work.
Glacier Monitoring builds that record from wide-swath optical archives, mapping seasonal ice and snowline extent for the glaciers feeding a catchment so the accumulation zone and ablation zone split is there for each year rather than reconstructed from whatever single image happened to be available.
If you're trying to put a number on how your basin's glaciers are trending rather than guessing from a handful of field photos, that's the gap this is built to close.