Field notes
Firn line vs snowline: what's the difference?
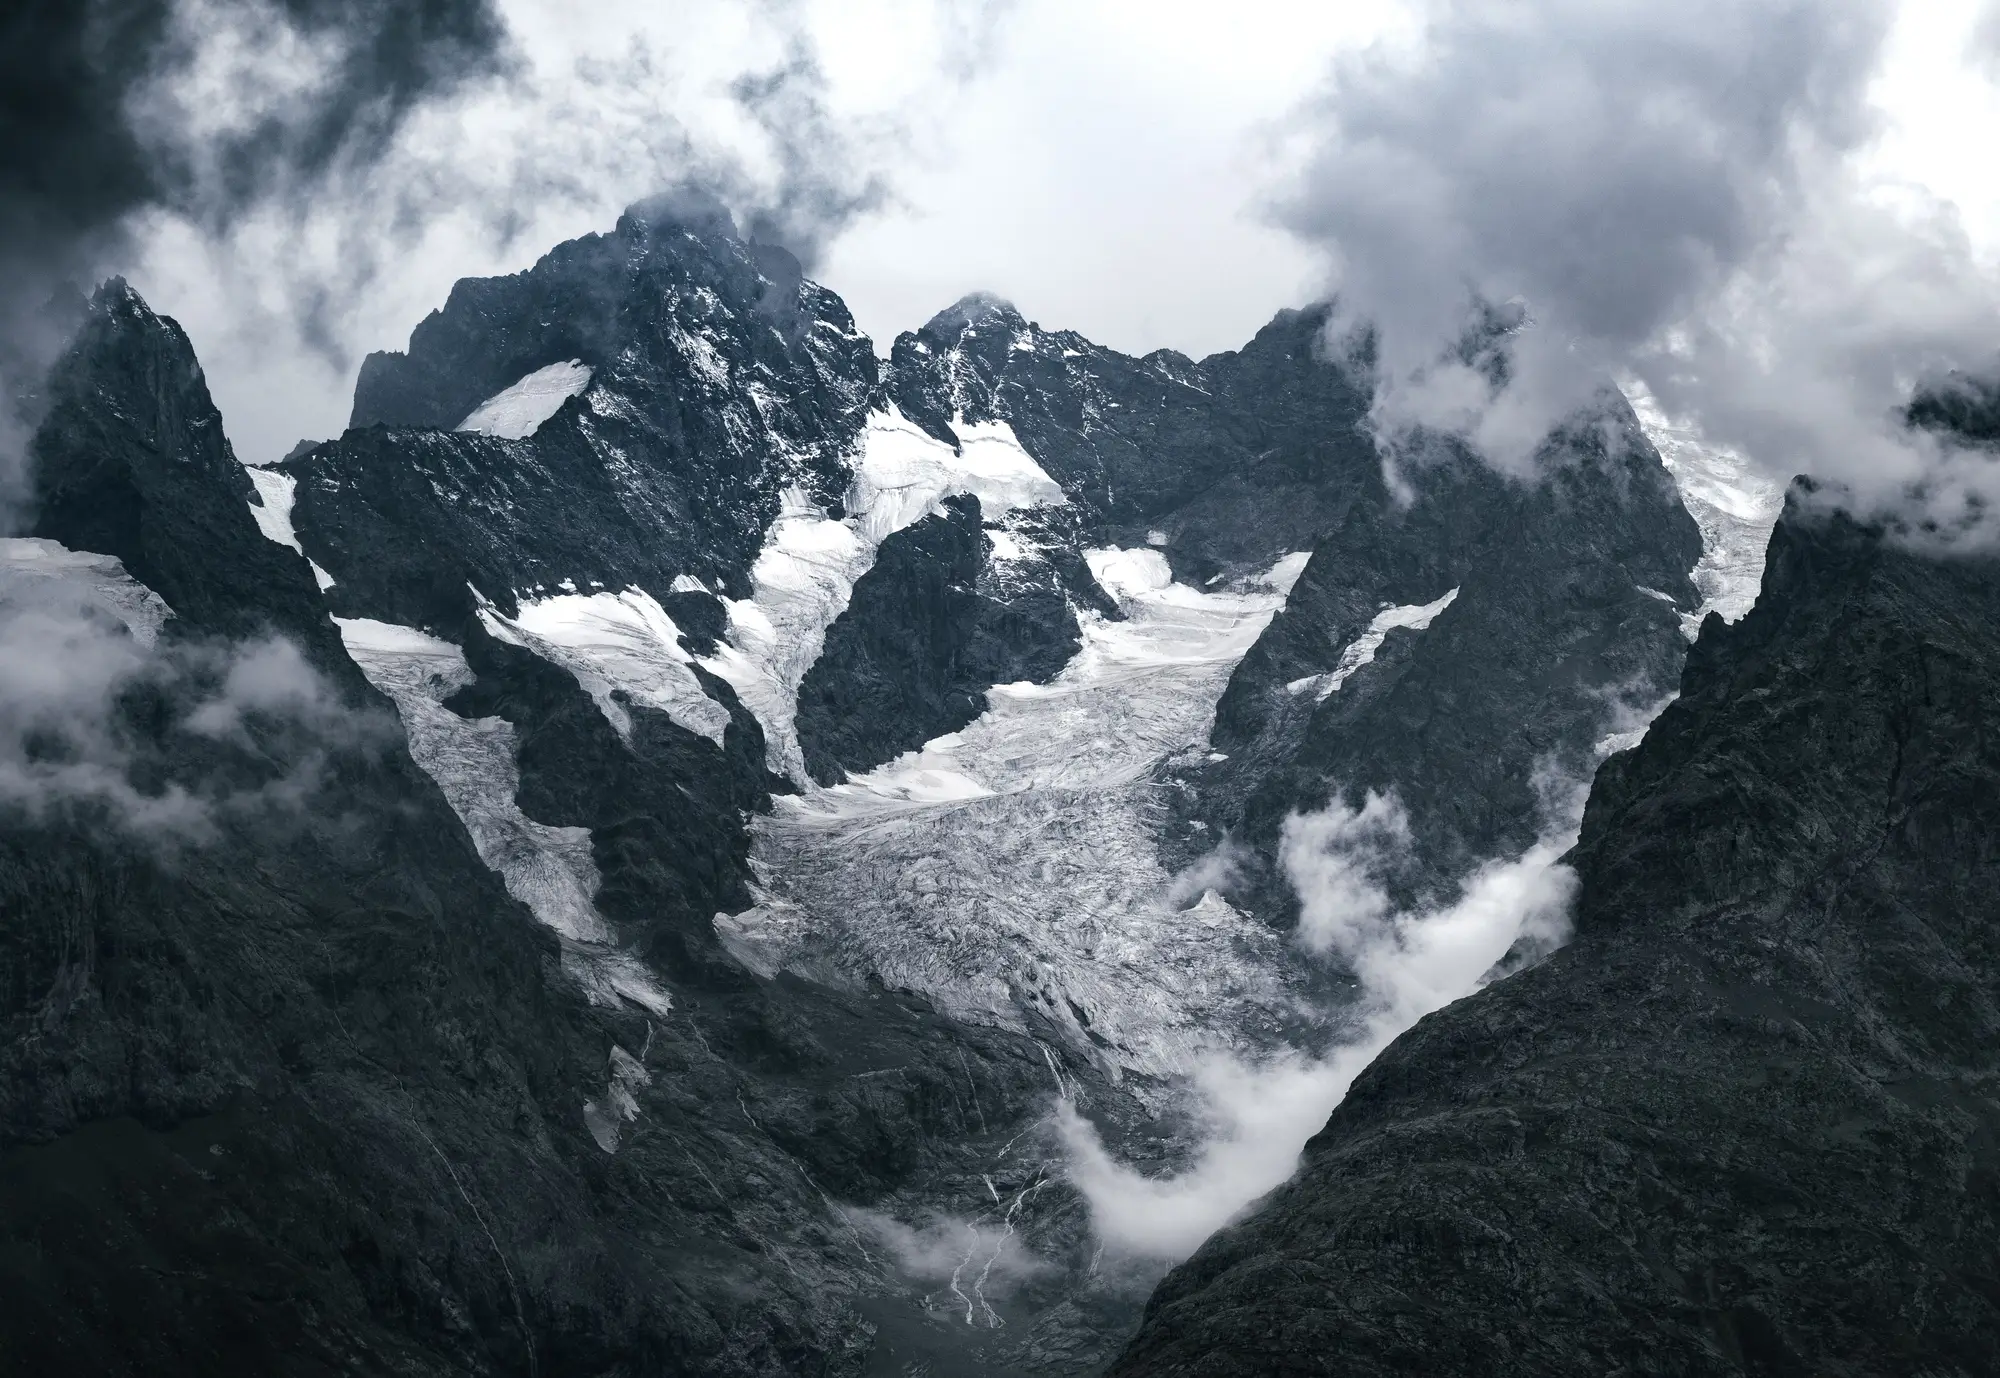
If you've ever stood at a glacier terminus in September and tried to point out "the snowline" to someone, you've probably run into the same confusion we get from field staff every year: snowline and firn line are not the same boundary, and mixing them up throws off any attempt to track accumulation zone area over time.
The snowline is whatever's white today
The snowline is simple and a little unsatisfying: it's the elevation on a given day where snow cover starts. Walk up a glacier in June and the snowline might sit at 2,400 meters. Come back in August after three weeks of clear skies and it could be 600 meters higher. Snow a storm drops on Tuesday pushes it back down by Friday. It's a weather-driven line, and on its own it tells you almost nothing about the glacier's long-term health.
What matters for mass balance work is the late-season snow line, the position of that boundary at the end of the melt season, usually read off imagery from late August or September in the Northern Hemisphere. That's the line that approximates the equilibrium line altitude for the year, the elevation above which the glacier gained mass and below which it lost it. One late-season snow line from one year is a data point. A season-by-season record of where that line sits, year over year, is a trend.
The firn line marks what survived
The firn line is a different animal entirely. Firn is old snow, usually more than one melt season old, that's been compacted and partially recrystallized but hasn't yet turned into glacial ice. The firn line is the boundary between bare glacier ice below and firn above it, and because firn takes more than one year to build up, that line reflects accumulated history rather than a single season's weather.
Here's the practical distinction a lot of basin studies gloss over: a glacier can have a late-season snow line that looks reasonable in a given year (decent winter snowpack, a cool summer) while its firn line has been creeping upward for a decade. The snow line tells you about this year. The firn line tells you whether the accumulation zone, the part of the glacier that's supposed to be gaining mass, has been shrinking underneath that single good year.
Glacier facies: the vocabulary that ties it together
Glaciologists sort a glacier's surface into zones, often called facies, based on how snow and ice have transformed in that spot. From top to bottom you typically move through dry snow, percolation, wet snow, and the superimposed ice zone before hitting bare ice. The firn line and the snowline are both boundaries between these facies, just measured at different timescales. A single optical image taken at the right time of year can show you these zones directly, because dirty, old firn reflects differently than fresh snow or exposed glacier ice.
This is also where remote sensing earns its keep over a single field visit. A field crew can measure the snowline at one point on one day with a GPS and a notebook. Getting the firn line, and tracking how it's moved across the whole glacier over fifteen or twenty seasons, needs a stack of late-summer images spanning that whole period, classified consistently each year.
Why the distinction matters for your catchment
If your job is projecting how much meltwater a glacier-fed catchment will contribute over the next few decades, the accumulation zone size (bounded, loosely, by that firn line) is more useful than any single year's snowline position. A shrinking accumulation zone relative to the total glacier area is one of the clearest signs a glacier is heading toward negative mass balance long term, independent of how any one winter's snowpack looked.
This kind of multi-year, same-season comparison is hard to build from field notes alone and slow to commission as a one-off study. Glacier Monitoring pulls seasonal ice and snowline extent for the glaciers feeding your basin from decades of optical archive, so you can see where that boundary has moved. If tracking the firn line across your catchment's glaciers is on your list, take a look at what the seasonal retreat time series looks like for your basin.