Field notes
How to estimate glacier meltwater's share of streamflow
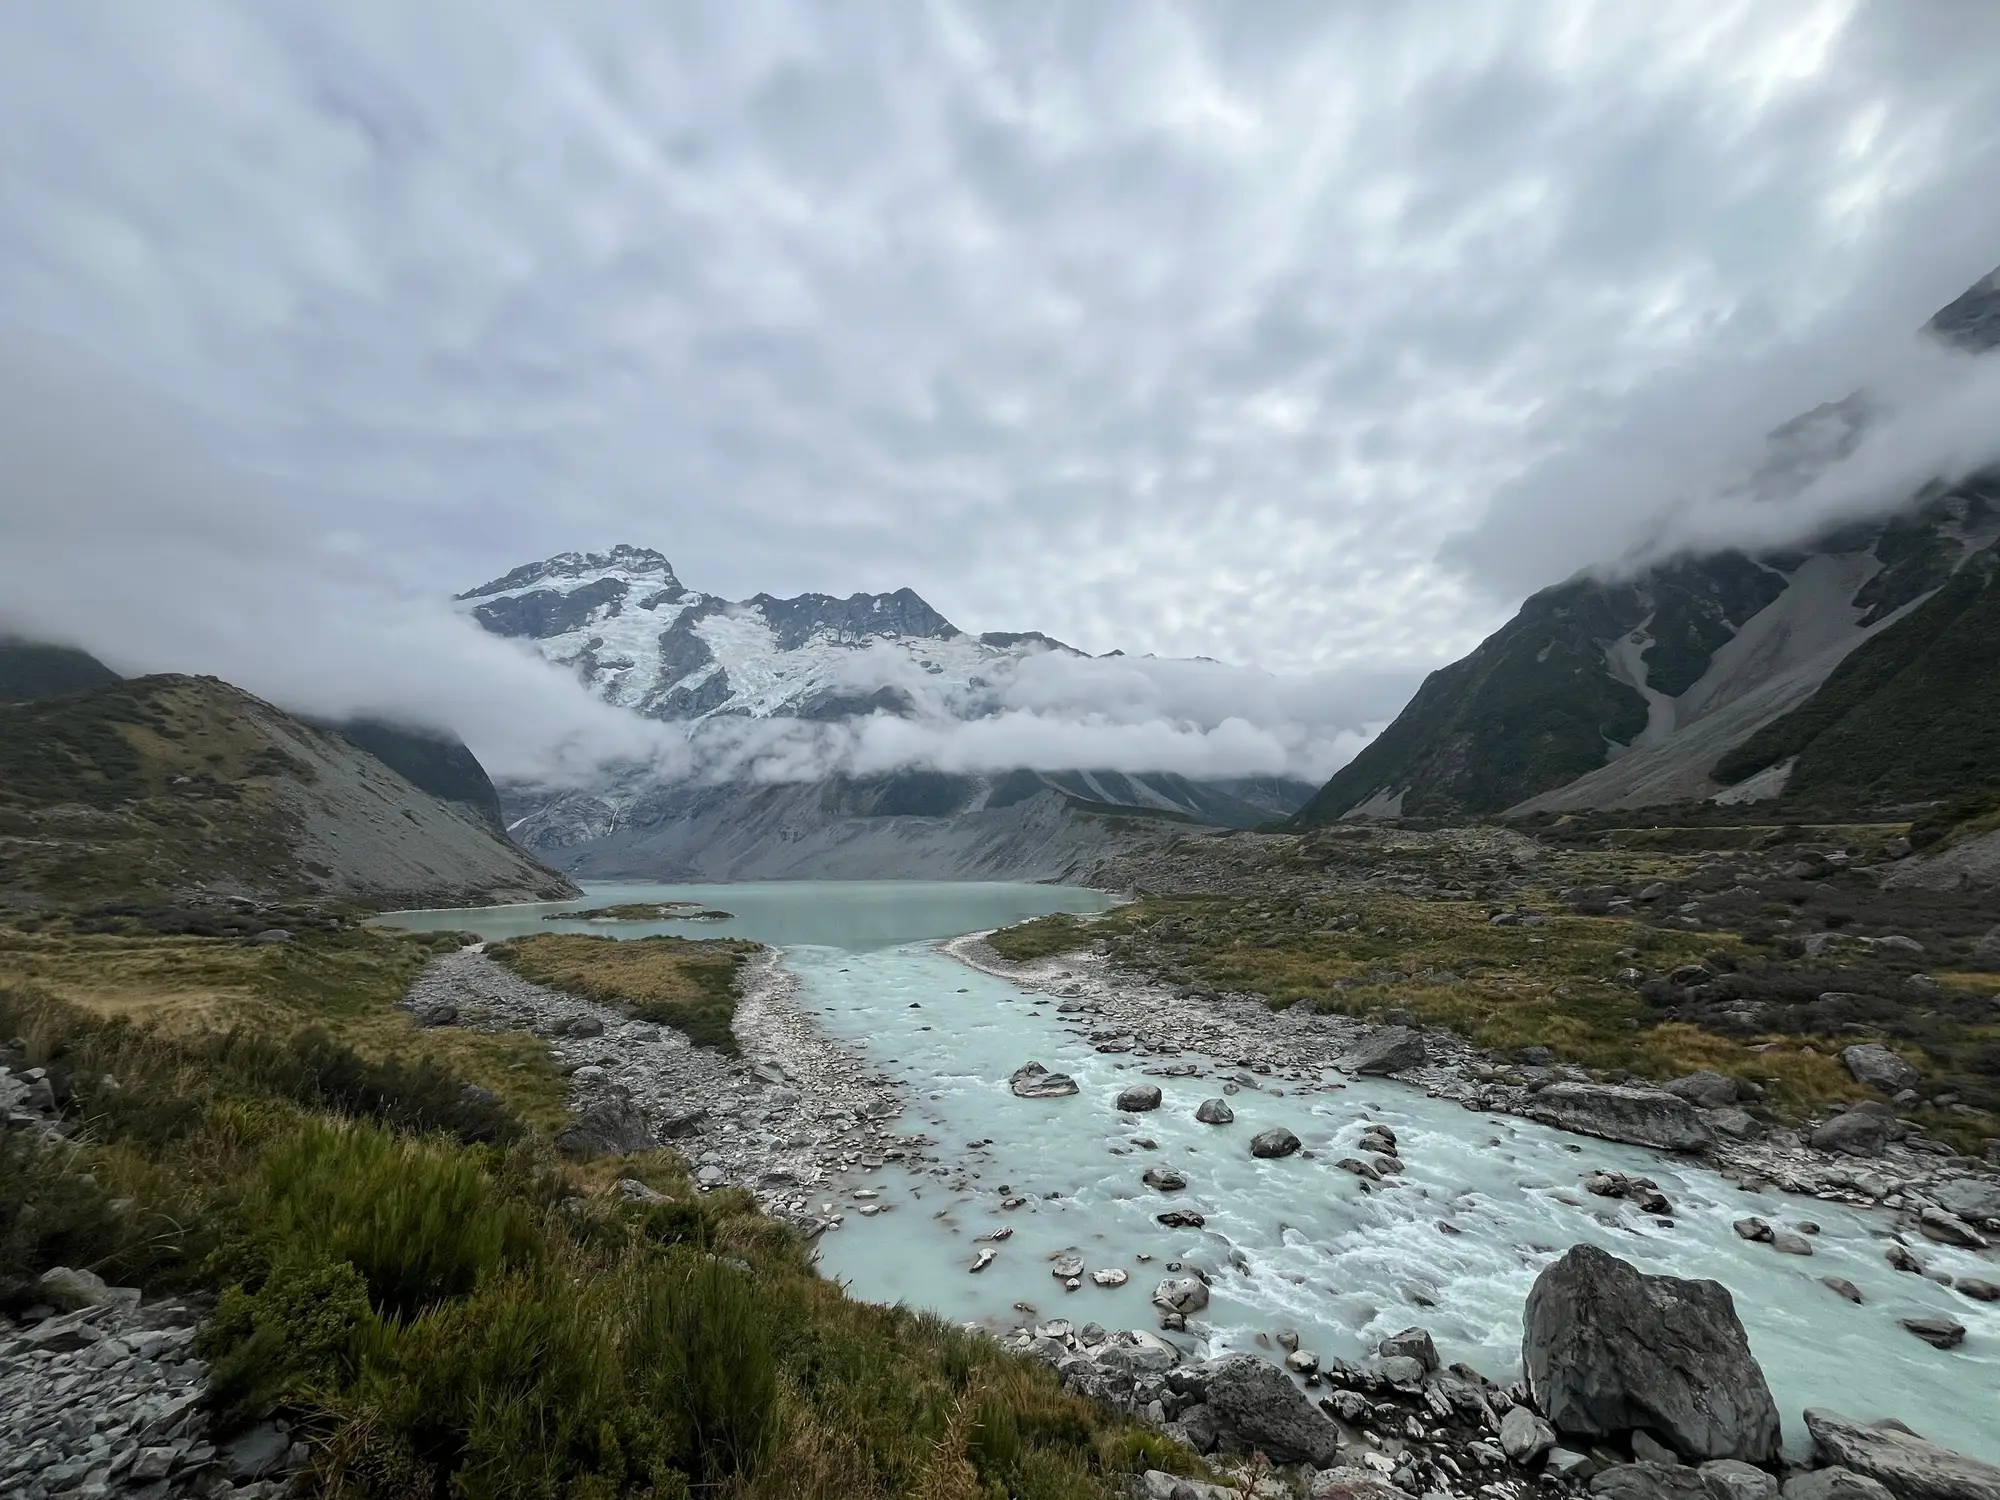
If you look after a glacier-fed catchment, the question comes back every water year: how much of the summer flow at the gauge comes from glacier ice, and how much from seasonal snowpack that would melt out in a cold year too. The answer feeds allocation planning. It also tells you how much of your late-summer flow is drawn from ice storage that this winter's snow won't replace.
No single instrument gives you a percentage. You build the estimate from a few lines of evidence that should roughly agree, and the uncertainty band is set by the weakest of them.
Start with the basin water balance
The usual frame over a water year is P = Q + ET + ΔS. In a year when the glaciers lose mass, ΔS is negative, and that loss shows up as runoff over and above what precipitation can explain. With reasonable precipitation and ET estimates for the catchment and a good discharge record at the outlet, the residual gives a first-order figure for net storage loss, most of it glacier ice. Snow that falls and melts within the same year sits inside P, so this step won't give you total melt or split snow from ice. What it does give is a bound on the ice-storage term that your hydrograph separation has to respect. Mountain precipitation is often undercaught at gauges, so treat the residual as a loose check rather than a measurement.
Separating icemelt from snowmelt in the hydrograph
With the storage term bounded, the next step is usually isotopic hydrograph separation. You sample oxygen-18 or deuterium at the outlet through the melt season, and at the end-member sources: fresh snow, bare ice and groundwater. A two- or three-component mixing model then gives a daily or weekly split. Snow and ice signatures can sit close together, so many studies add electrical conductivity as a second tracer to pull groundwater apart from the melt components. It takes a lot of fieldwork. You need regular sampling right through the ablation season, and a couple of grab samples in July won't do it.
Where isotopes aren't practical, a temperature-index (degree-day) melt model run separately over the glacierised and ice-free parts of the catchment gives you a modelled split instead of a measured one. The result leans heavily on the degree-day factors for ice and snow. Bare ice has a lower albedo and melts more per degree-day than snow, so a single blended factor across the catchment will bias the split.
Paired gauges help as a check. If you have one on a glacierised sub-catchment and one on a comparable ice-free catchment nearby, compare their recession behaviour and late-summer flows against what either method above tells you.
Where satellite ice extent fits in
Each of these methods needs a current figure for glacierised area, and for where the snowline sits on the ice each season. The degree-day model applies its ice factor to the bare-ice area, and that area moves in two directions. As the glaciers shrink, there is less ice to melt; in a year when the snowline climbs early, more of what's left is exposed for longer. Both change the icemelt term from one year to the next even at similar temperatures. For an agency without its own field programme on the ice, this is usually the hardest input to keep up to date.
Seasonal ice and snowline maps for the glaciers in your catchment are built from multi-decade optical archives, so you get a year-by-year retreat series rather than a single area figure that ages every season. They show extent in plan view only, with no volume or mass estimate. The meltwater share still comes from the water balance and hydrograph work above, with the mapped area as one of its inputs.
If the glacierised area in your model hasn't been updated in a while, a seasonal ice extent layer and retreat time series for the glaciers feeding your basin is what we produce.