Field notes
Separating snowmelt and glacier melt in a hydrograph
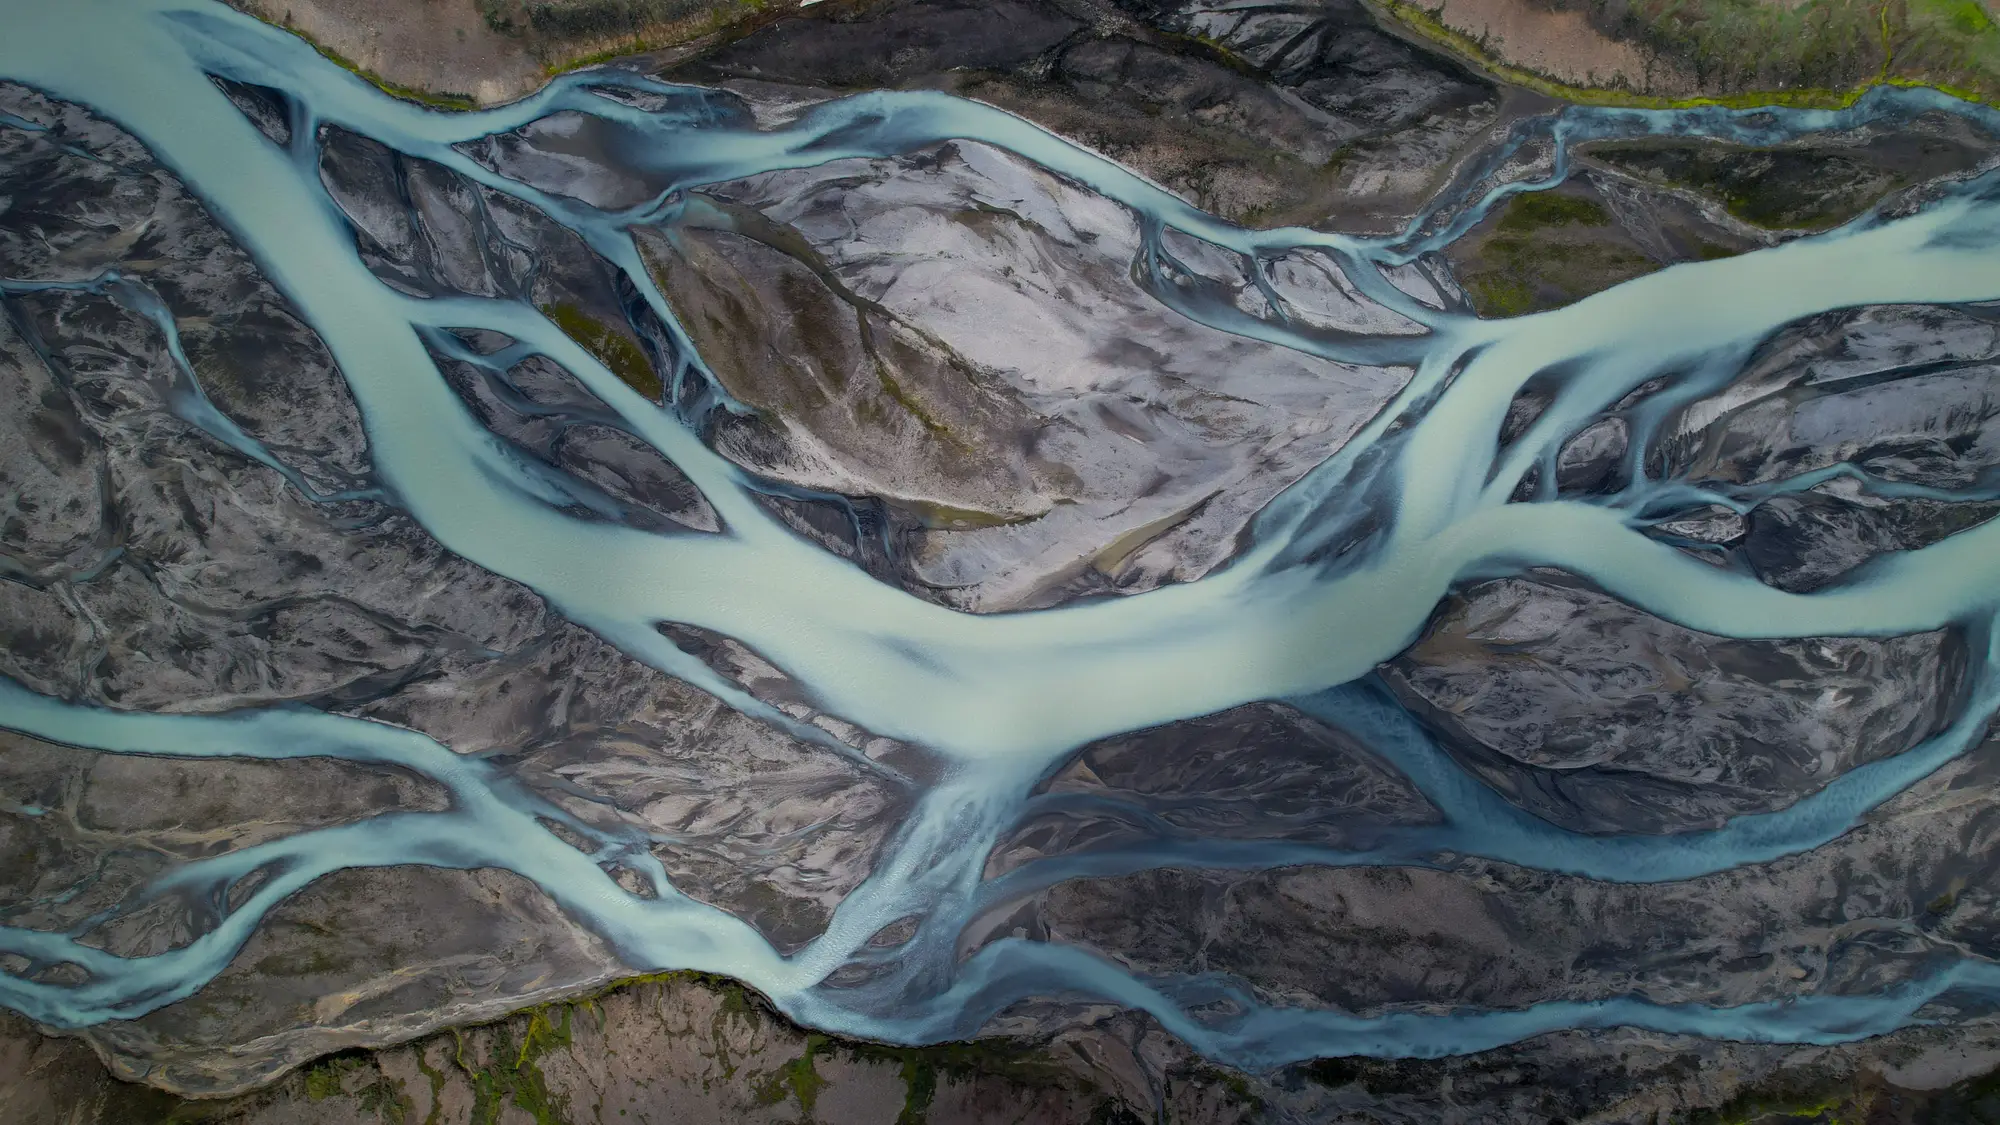
A single hydrograph from a glacier-fed gauge carries at least two melt signals stacked on top of each other, and sometimes three once you add rain-on-snow events into the mix. Snowpack melts out over weeks in late spring and early summer. Glacier ice keeps melting through August and into September, long after the snowpack is gone. Pulling those two signals apart matters if you're trying to figure out how much of this year's low-flow August streamflow you can count on in a hotter, drier decade, because the snowpack answer and the glacier answer point in very different directions.
Timing is the first clue, but it isn't enough on its own
The classic tell is the shift in peak timing as the season goes on. Early-season flow tracks snowmelt closely: it rises and falls with air temperature and solar input across the snow-covered basin, and it tends to flatten out once the snowline has retreated above most of the catchment. Glacier melt behaves differently. It peaks later, runs through the hottest part of summer, and shows a sharper diurnal cycle because bare ice absorbs more shortwave radiation than snow does and melts faster per degree of warming. If you plot discharge against day of year for several seasons, the glacier-melt tail often shows up as a bump or a shoulder on the recession limb, after the snowmelt pulse has already faded.
The trouble is that a warm, low-snow year can mimic an early glacier signal, and a cool, wet year can mask a real glacier contribution almost entirely. Timing alone tells you something is happening in August. It doesn't tell you how much of the basin's ice is exposed and melting versus still buried under snow or firn, and that's the detail separating a weather story from a long-term trend.
Tracers and recession shape do more of the separation
Stable isotopes, δ18O and δ2H, are the standard tool for a proper hydrograph separation. Glacier ice carries an isotopic signature distinct from seasonal snow, built up over years of accumulation and metamorphism, so sampling streamflow through the melt season and running a two- or three-component mixing model gives you an actual percentage split between snowmelt, icemelt, and groundwater baseflow. Electrical conductivity works as a rougher proxy where isotope sampling isn't practical. Ice-sourced meltwater is typically lower in dissolved solids than groundwater, so a conductivity dip during the peak melt window can back up what the isotopes are showing.
Recession curve analysis adds the piece that tracers can't give you by themselves: how fast the glacier-melt component is declining year over year, independent of what the snowpack did. A basin whose August recession keeps getting shallower, meaning flow holds up better late in the season, is usually losing glacier ice extent and seeing more exposed, faster-melting bare ice in response. A basin whose August recession is getting steeper, with flow dropping off harder once the easy snowmelt is spent, is often a sign the glacier contribution itself is shrinking as the ice retreats and thins. Degree-day melt models can help attribute the recession shape to temperature versus to a genuine loss of ice area, but only if you know roughly how much glacier and snowline extent you're working with each season, not just this year's.
That's the gap a lot of hydrograph separation work runs into. You can isotope-sample a gauge for a season and get a tight mixing-model answer for that year, but without a multi-year read on how the ice extent and snowline in your upstream catchment have actually moved, you're separating signals without knowing whether the glacier side of the split is a stable long-term supply or a shrinking one. Glacier Monitoring builds that seasonal extent record from decades of satellite imagery so you can put a retreat trend behind the melt signature you're pulling out of the hydrograph, instead of guessing at it from one melt season's isotope data.
If your tracer work keeps turning up a shrinking icemelt share and you want the retreat trend behind it, that's what Glacier Monitoring maps.