Field notes
How to spot supraglacial lakes and debris cover in satellite imagery
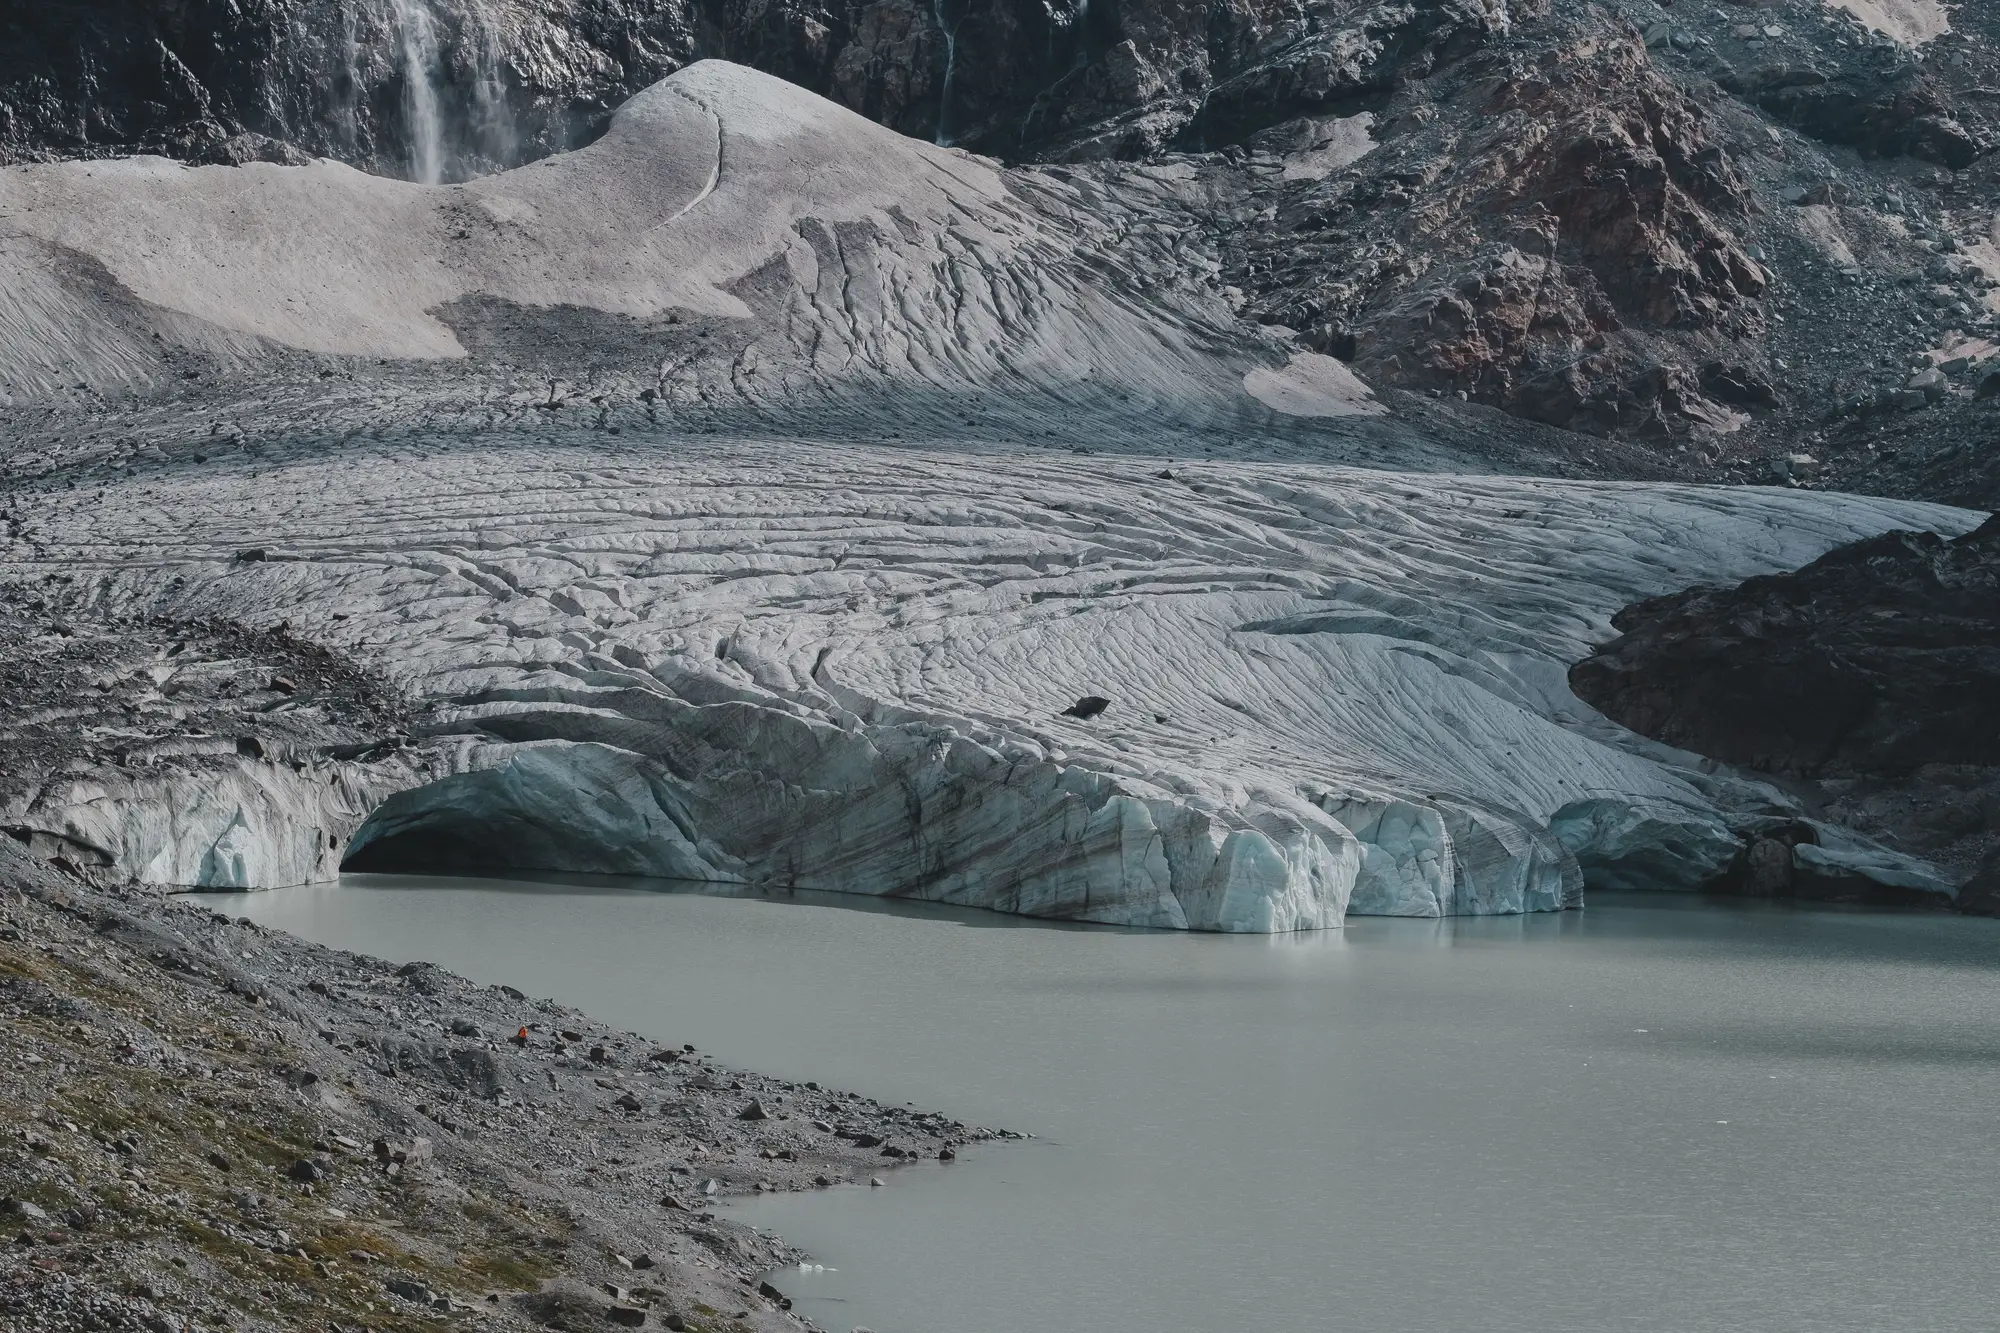
Debris-covered tongues and supraglacial lakes are the two things that make glacier mapping from optical imagery harder than it looks on paper. A clean white icefield against dark rock is easy to threshold. A rock-covered terminus sitting on ice, or a turquoise pond on the ablation zone, will throw off a straight NDSI cutoff. If you're tracking glacier extent for a catchment water budget, these are the cues that separate the two from the surrounding terrain, and the places where they stop working.
Supraglacial lakes show up in colour and in the near-infrared
Supraglacial lakes sit on top of the ice in the ablation zone, usually where meltwater ponds in a surface depression instead of draining through a moulin. In true-colour imagery they read as flat, saturated turquoise to deep blue patches with sharp, rounded edges. Proglacial lakes down at the terminus look different: milky grey-green, because they carry more suspended sediment.
The giveaway band is the near-infrared. Water absorbs NIR strongly, so a lake goes close to black in a NIR band while the ice around it stays bright. McFeeters' NDWI, (green − NIR) / (green + NIR), picks this up, and so does a false-colour composite with NIR in the red channel: lakes drop out as dark holes in a bright glacier surface. Lakes smaller than a few pixels will blur into the ice around them at 10–30 m, so a lake count from wide-swath imagery is a floor.
Lake area swells through the melt season and can shrink fast when a lake overtops or a moulin opens underneath it. One summer scene can catch a lake at a very different size from the same calendar date the year before. If you're building a seasonal time series, log each acquisition date against the melt calendar for that basin, not just the year.
Debris cover needs more than spectral bands
Debris-covered ice is the harder problem, and the one optical mapping handles worst. Rock debris on the surface has roughly the same reflectance as the lateral moraine and valley walls around it. Spectral classification alone (NDSI, simple band ratios) will call a debris-covered tongue "not ice" even when it's moving glacier under a metre or more of rubble. That's the main reason debris-covered termini get left off or drawn short on basic snow-cover products.
Analysts use a few extra cues to pull it back in:
- Surface texture. Debris cover is hummocky, with ice cliffs and thermokarst ponds that off-glacier rock slopes don't show. You need panchromatic or metre-scale imagery to see that texture; at 10–30 m most of it is lost.
- Slope and curvature from a DEM. Debris-covered tongues sit on the shallow valley floor where a terminus should be, not on the steeper moraine crests beside them.
- Continuity with the clean-ice zone. Trace the debris patch upglacier. If it joins clean ice higher up without a break, it's very likely glacier, not a rockfall apron or an isolated moraine remnant.
- Multi-year comparison. Thick debris insulates the ice, so a debris-covered tongue tends to thin in place rather than pull back. A margin that has held still for a decade while the clean ice upglacier retreats is often debris-covered ice, though stagnant ice and bare moraine can look the same from above.
None of this replaces careful digitising by someone who has traced glaciers before, often with field photos or a survey to check against. Even then, the debris-covered margin is where two careful analysts will draw different lines. For a basin-wide trend, the honest approach is to map the clean ice well and say plainly where rubble hides the true edge.
That's how we treat it in our seasonal ice extent maps for a catchment, which flag where debris cover makes the mapped outline fall short.