Field notes
Snow cover extent vs snowline elevation: what each measure tells you
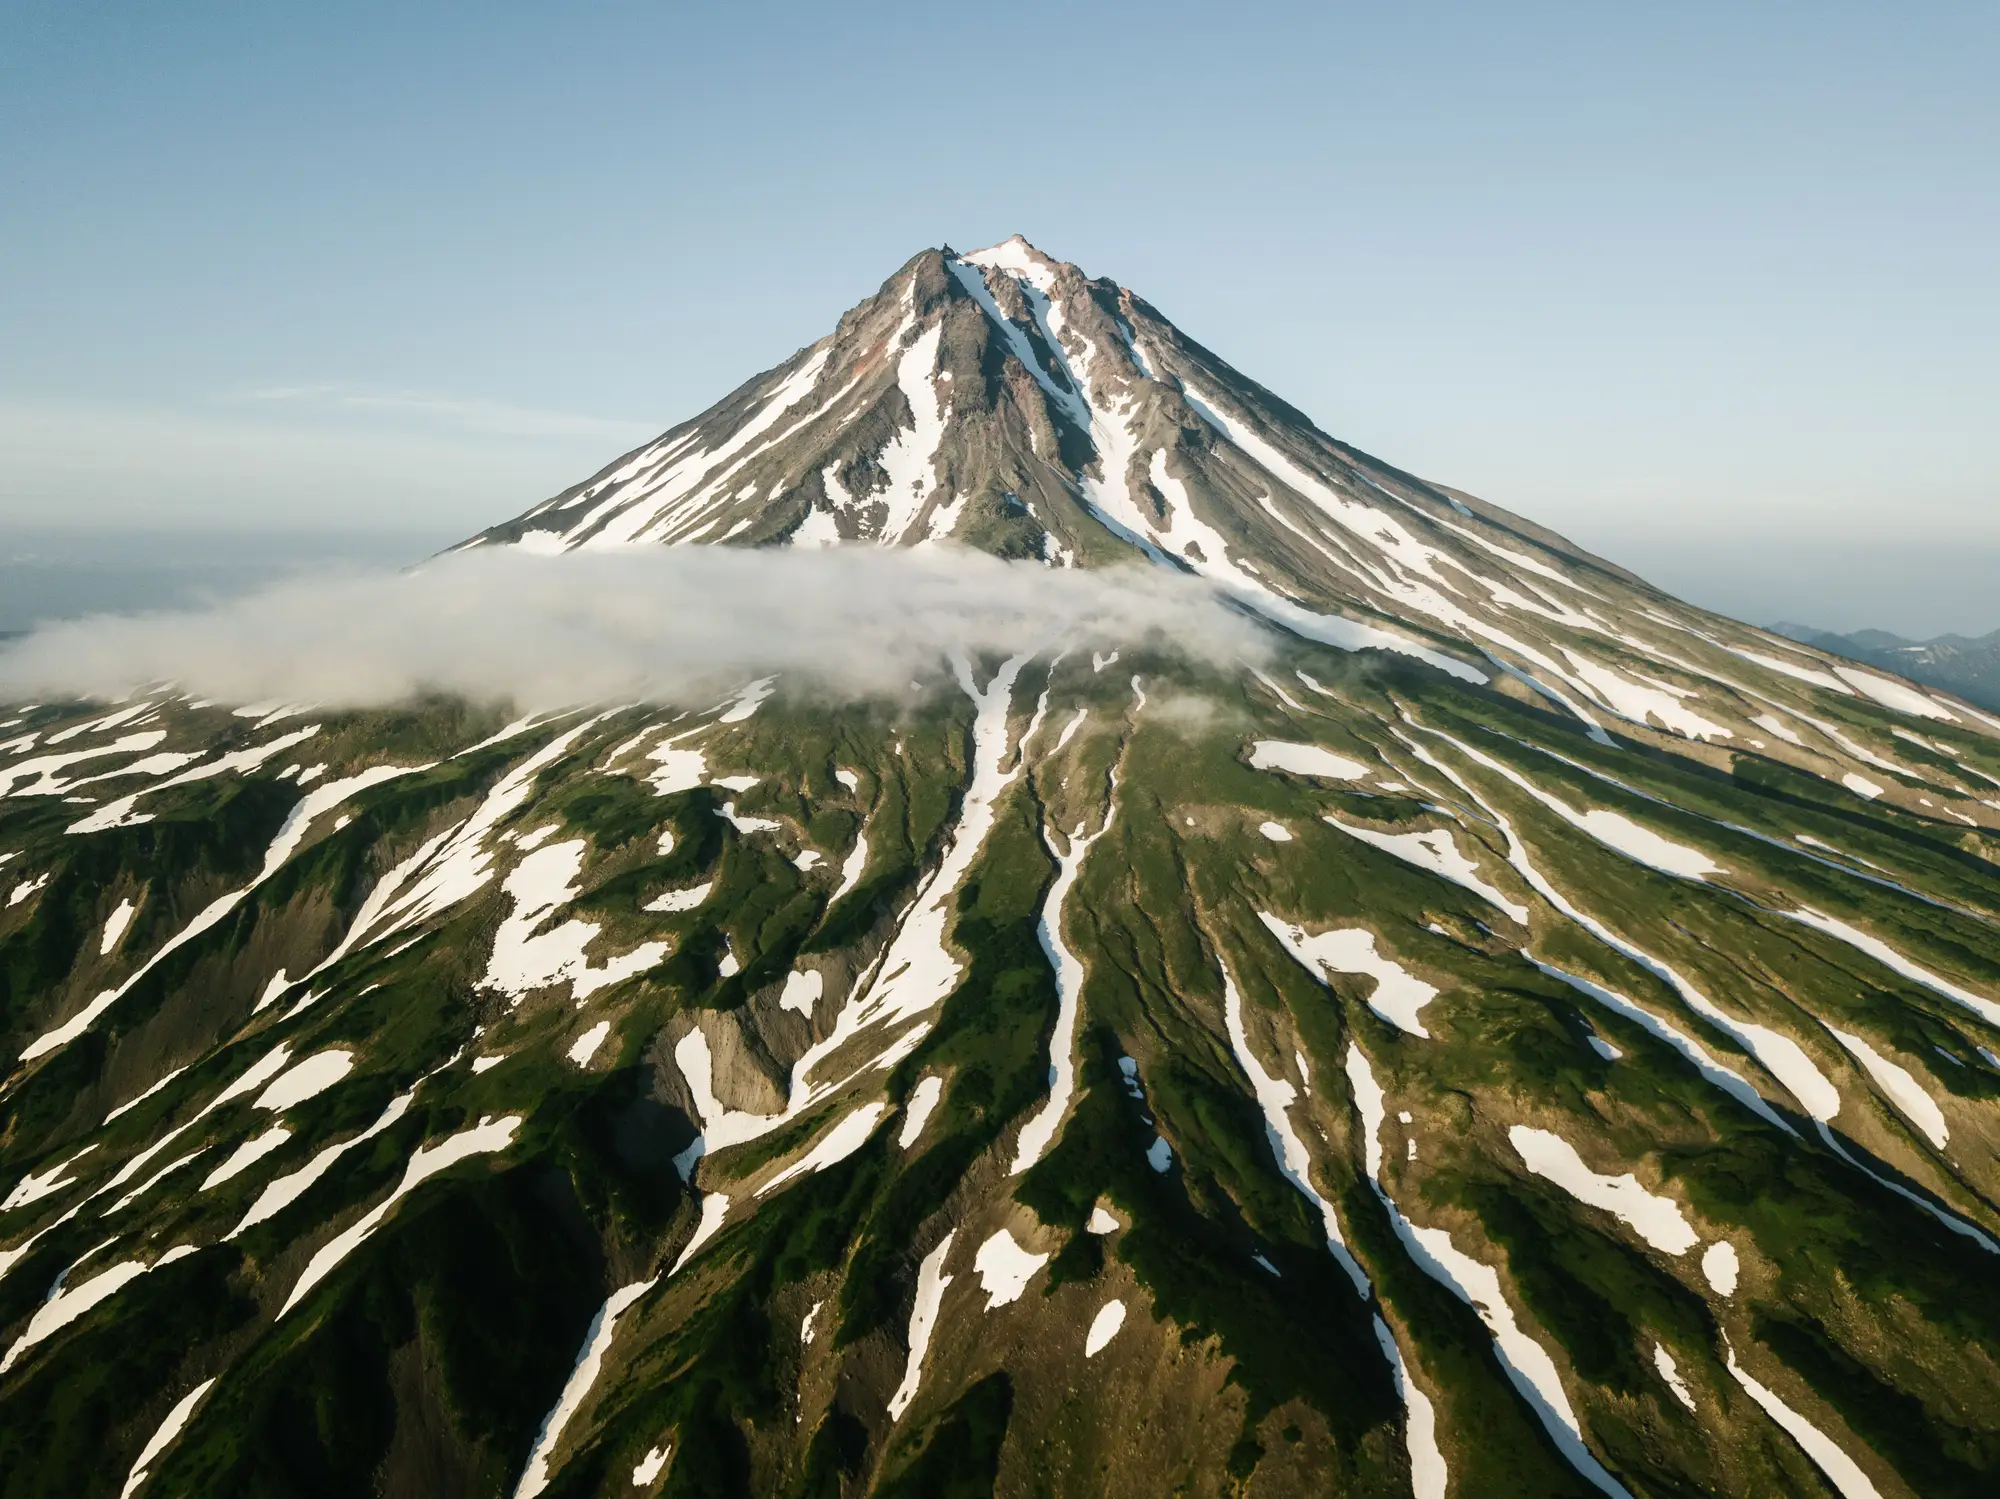
If you've pulled a snow cover product for a basin report and then had someone ask about "the snowline" in the same meeting, you'll know the two terms get used interchangeably. They measure different things. One is an area and the other is a boundary. Mixing them up rarely breaks a report, but it can make a trend look noisier than it is.
Two different measurements, two different questions
Snow cover extent is a binary map for a given date: pixel by pixel, is there snow or not. Sum the snow pixels across your catchment and you get a percentage, or an area in square kilometres. It answers "how much of the basin is under snow today." It reacts to a single storm, a warm spell or cloud on the scene date. A snow cover map from 3 March and one from 17 March in the same year can look quite different with no real change in the season's trajectory, just because a system moved through.
Snowline elevation is a single number (or a contour, if you want it mapped rather than reported): the elevation at which continuous snow cover begins on a given slope or in a given basin, on a given date. It answers a narrower question, "how high has the snow retreated," and because it's tied to elevation rather than raw area, it moves less from one scene to the next. In complex terrain, with north-facing shaded pockets holding snow low while south-facing slopes clear early, the extent map gets messy long before the snowline reading does.
Both come from the same optical imagery. The difference is what you do with the pixels afterwards. For extent you sum them. For snowline you find the boundary and read its height off a DEM.
Where the snowline meets the equilibrium line
This is where it gets useful for glacier work. Late in the ablation season, on a clear scene with no fresh snow, the snowline on a glacier approximates the equilibrium line altitude (ELA). That's the elevation dividing the accumulation zone, where the glacier gained mass over the year, from the ablation zone, where it lost more than it gained. The approximation only holds near the seasonal minimum, typically late August to September in the Northern Hemisphere, before autumn snowfall resets things. Catch it too early and the line you're reading is still the seasonal snowpack retreating up the glacier, and it will sit below the ELA.
This is also why a single snowline reading from one date can mislead you. A late-August snowline sitting higher than last year could mean a worse mass balance year. It could also mean you caught a scene a week later in the melt cycle, while a scene taken just after a summer snowfall will pull the line down and flatter the glacier. The reading that tells you something is the same measurement repeated at roughly the same point in the season, year on year, so you're comparing like with like.
Why the accumulation zone matters for the melt season ahead
The ratio of accumulation zone area to total glacier area, the accumulation area ratio (AAR), is a rough shorthand glaciologists use for whether a glacier is close to balance or losing ground. A shrinking accumulation zone relative to total area, tracked across several end-of-summer scenes, is one of the more direct ways to see a glacier trending towards negative mass balance without waiting on a formal mass balance survey. It won't give you the precision of stake measurements or a field campaign. For catchment-level trend work, though, a multi-year record of end-of-summer snowline position does a lot of the job.
So pull extent when you need one number for how much snow is on the ground this week. When you're tracking how a glacier feeding your catchment is changing over the years, build a time series of end-of-summer snowline position and watch how it moves. That record comes much closer to a mass balance signal than any single snow cover map.
We build a seasonal ice extent layer and retreat time series from multi-decade optical archives for the glaciers feeding your basin.