Field notes
What is glacier hypsometry and why it controls melt timing
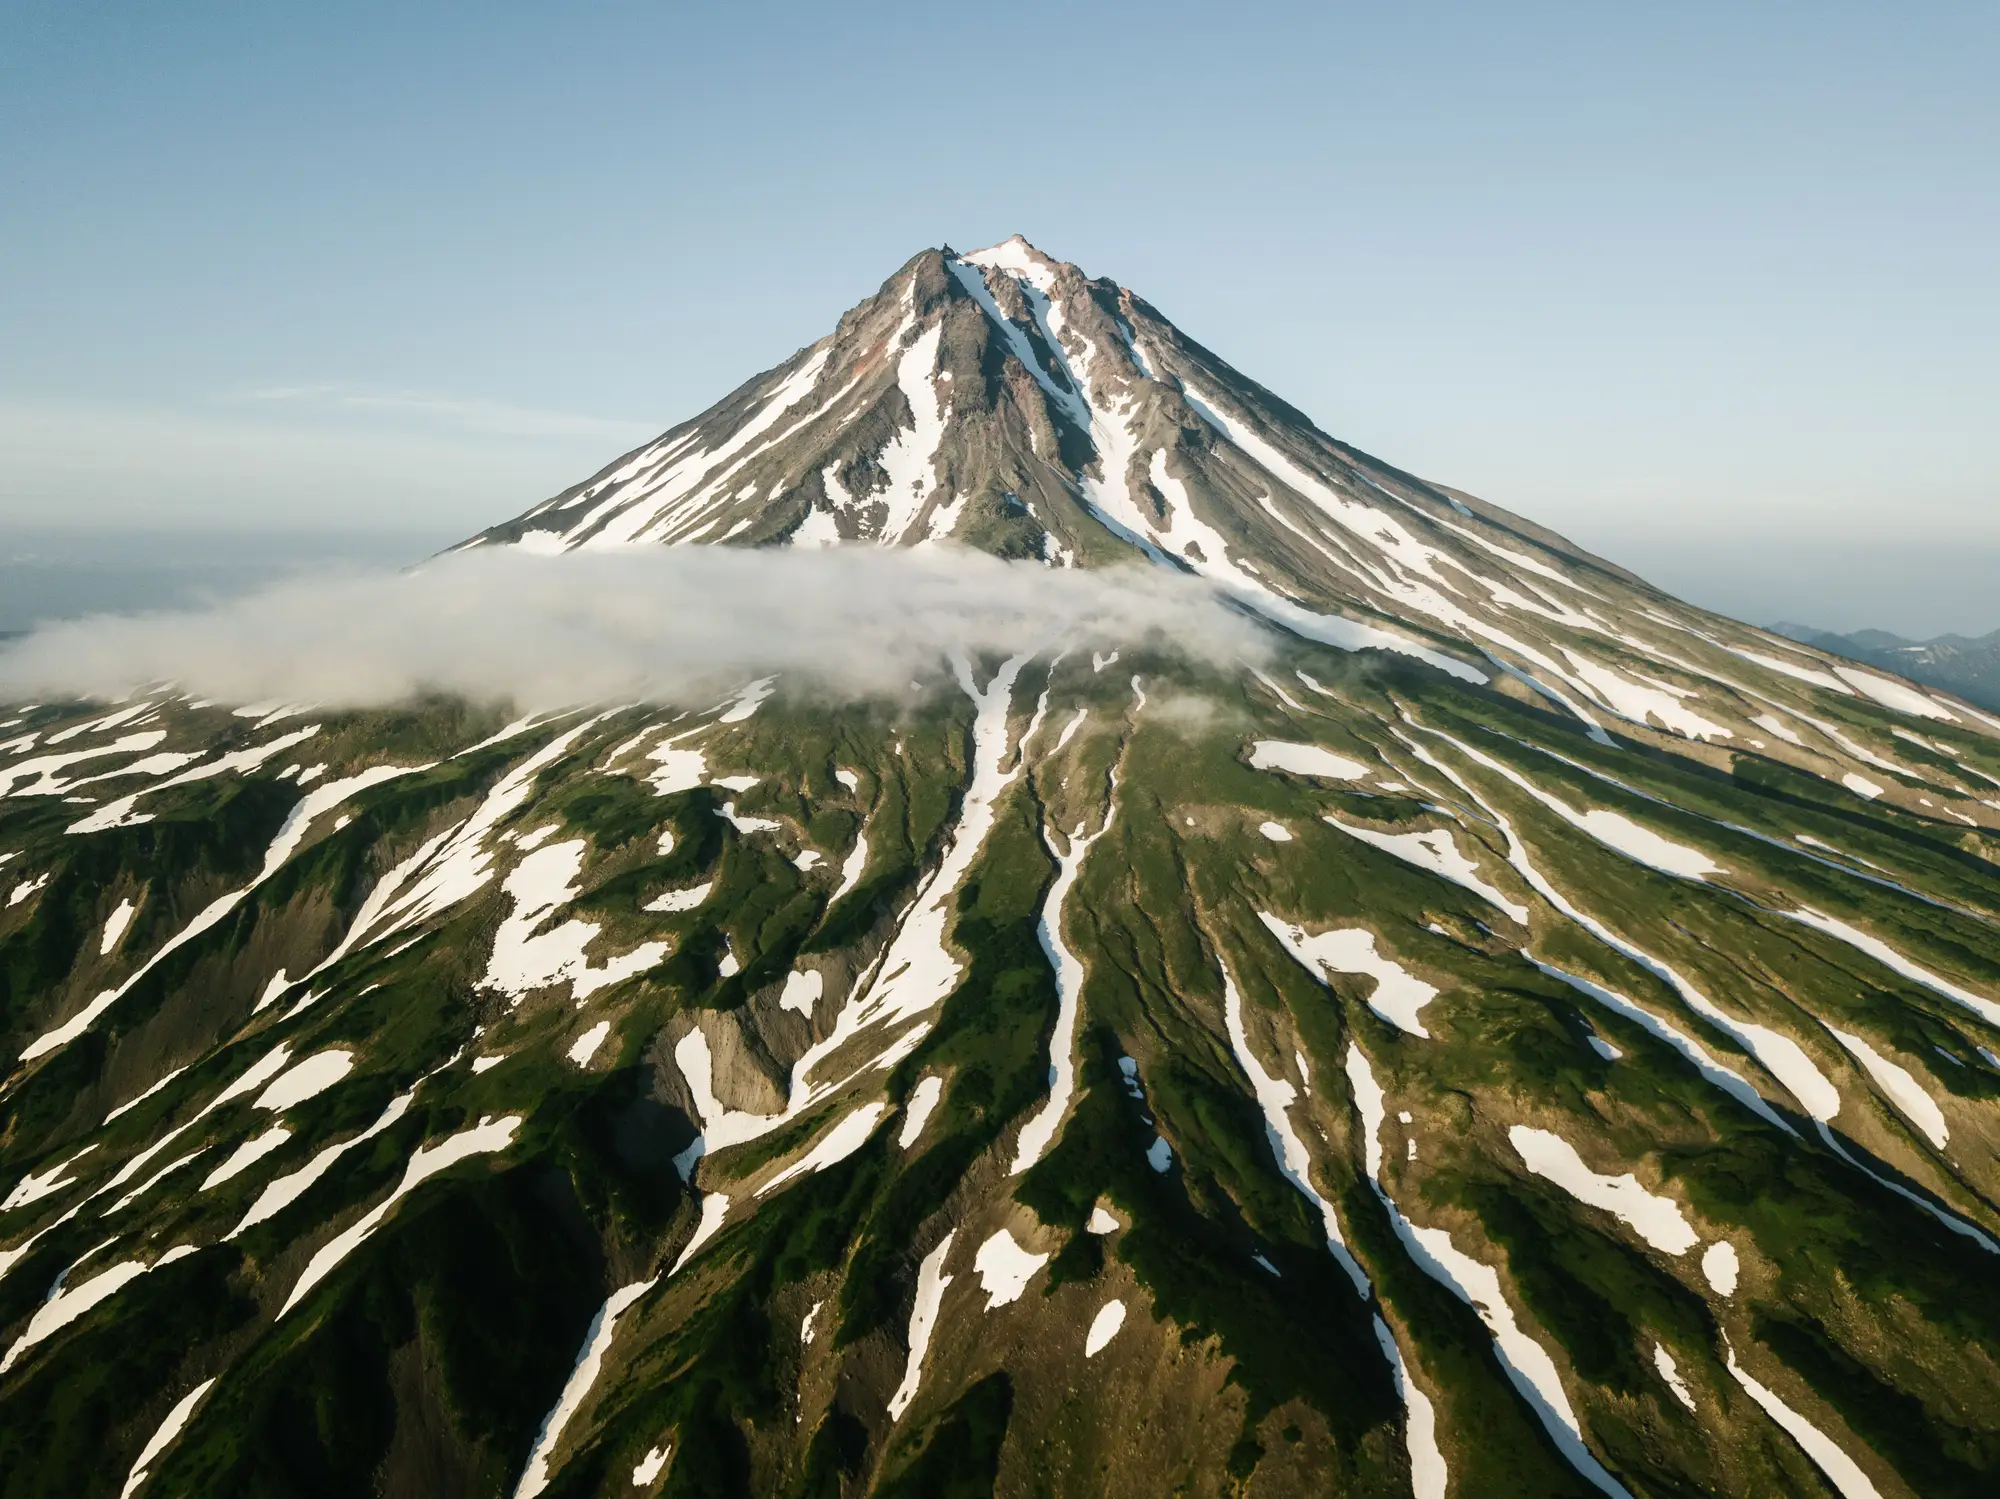
Glacier hypsometry describes how a glacier's area is distributed across elevation bands. Plot square kilometers of ice against 100-meter elevation bins and you get a curve: fat at the bottom, fat at the top, or roughly even through the middle. Hydrologists reading that curve are really asking one thing: when the equilibrium line moves up a glacier, how much ice does it expose to melt, and how fast?
Reading an area-elevation curve
Build one from a glacier outline draped over a DEM. Slice the glacier into elevation bands, usually 50 or 100 meters, and sum the ice area in each band. Plot elevation on the y-axis and area on the x-axis and you've got the hypsometric curve for that glacier.
Some glaciers are bottom-heavy: most of the ice sits low, near the terminus, with a long thin tongue of accumulation area reaching up into a cirque or ridge. Others are top-heavy: a broad plateau or ice cap up high feeding a short, steep tongue below. Most alpine glaciers in a working catchment fall somewhere in between, closer to equidimensional.
The hypsometric index (HI) puts a number on this. Take the elevation range above and below the median elevation and divide one by the other. A glacier with HI well below 1 is bottom-heavy. One with HI above 1 is top-heavy. Close to 1 means area spread roughly evenly through the elevation range.
Why the shape controls melt timing, not just melt volume
Hypsometry matters because the equilibrium line altitude (ELA) doesn't move in isolation. It moves across a fixed area-elevation distribution, and that distribution decides how much new ablation area gets exposed for a given rise in the ELA.
A bottom-heavy glacier has most of its area packed into the lower bands, right where the ELA tends to sit in a warm year. Push the ELA up by 50 or 100 meters on that glacier and you expose a disproportionate share of total area to melt. Runoff from that glacier reacts fast to a warm spring or a run of low-snow winters, and over a stretch of warm decades its area curve collapses from the bottom up: the tongue retreats, the terminus thins, and there's often little buffer left higher on the glacier.
A top-heavy glacier behaves differently. Most of its area sits well above where the ELA usually falls, so the same ELA rise exposes a smaller share of total ice. These glaciers hold onto contributing area longer and keep feeding meltwater into the catchment on roughly the same seasonal schedule even as the climate forcing keeps increasing. The hydrograph lags the forcing.
For a catchment fed by a mix of both types, that difference matters for forecasting. The bottom-heavy glaciers show earlier shifts in peak flow timing and faster area loss. The top-heavy ones look stable for longer, then move quickly once the ELA finally climbs into their main mass. Treating every glacier upstream of a gauge as one unit, when they have different hypsometric shapes, can hide which subcatchment is driving a change in the snowmelt-to-icemelt transition date.
Putting hypsometry to work on a real catchment
None of this requires a field campaign. The inputs are a DEM, a set of glacier outlines, and enough seasonal imagery to track how the ice and snowline extent move through those elevation bands year over year. A multi-decade record lets you check whether a glacier's current retreat matches what its hypsometric shape would predict, or whether something else, like a supraglacial debris cover or a shaded north aspect, is slowing the response down.
That's the layer we built Glacier Monitoring around: a seasonal ice extent map and retreat time series for the glaciers feeding your basin, pulled from wide-swath optical archives going back decades, so the area-elevation story for each glacier in the catchment is something you can read off a time series instead of estimating from a single outline.
If hypsometry is the piece that's been missing from your melt-timing forecasts, it's worth seeing what a few decades of seasonal extent data for your basin's glaciers look like.