Field notes
What the Randolph Glacier Inventory gives hydrologists, and what it doesn't cover
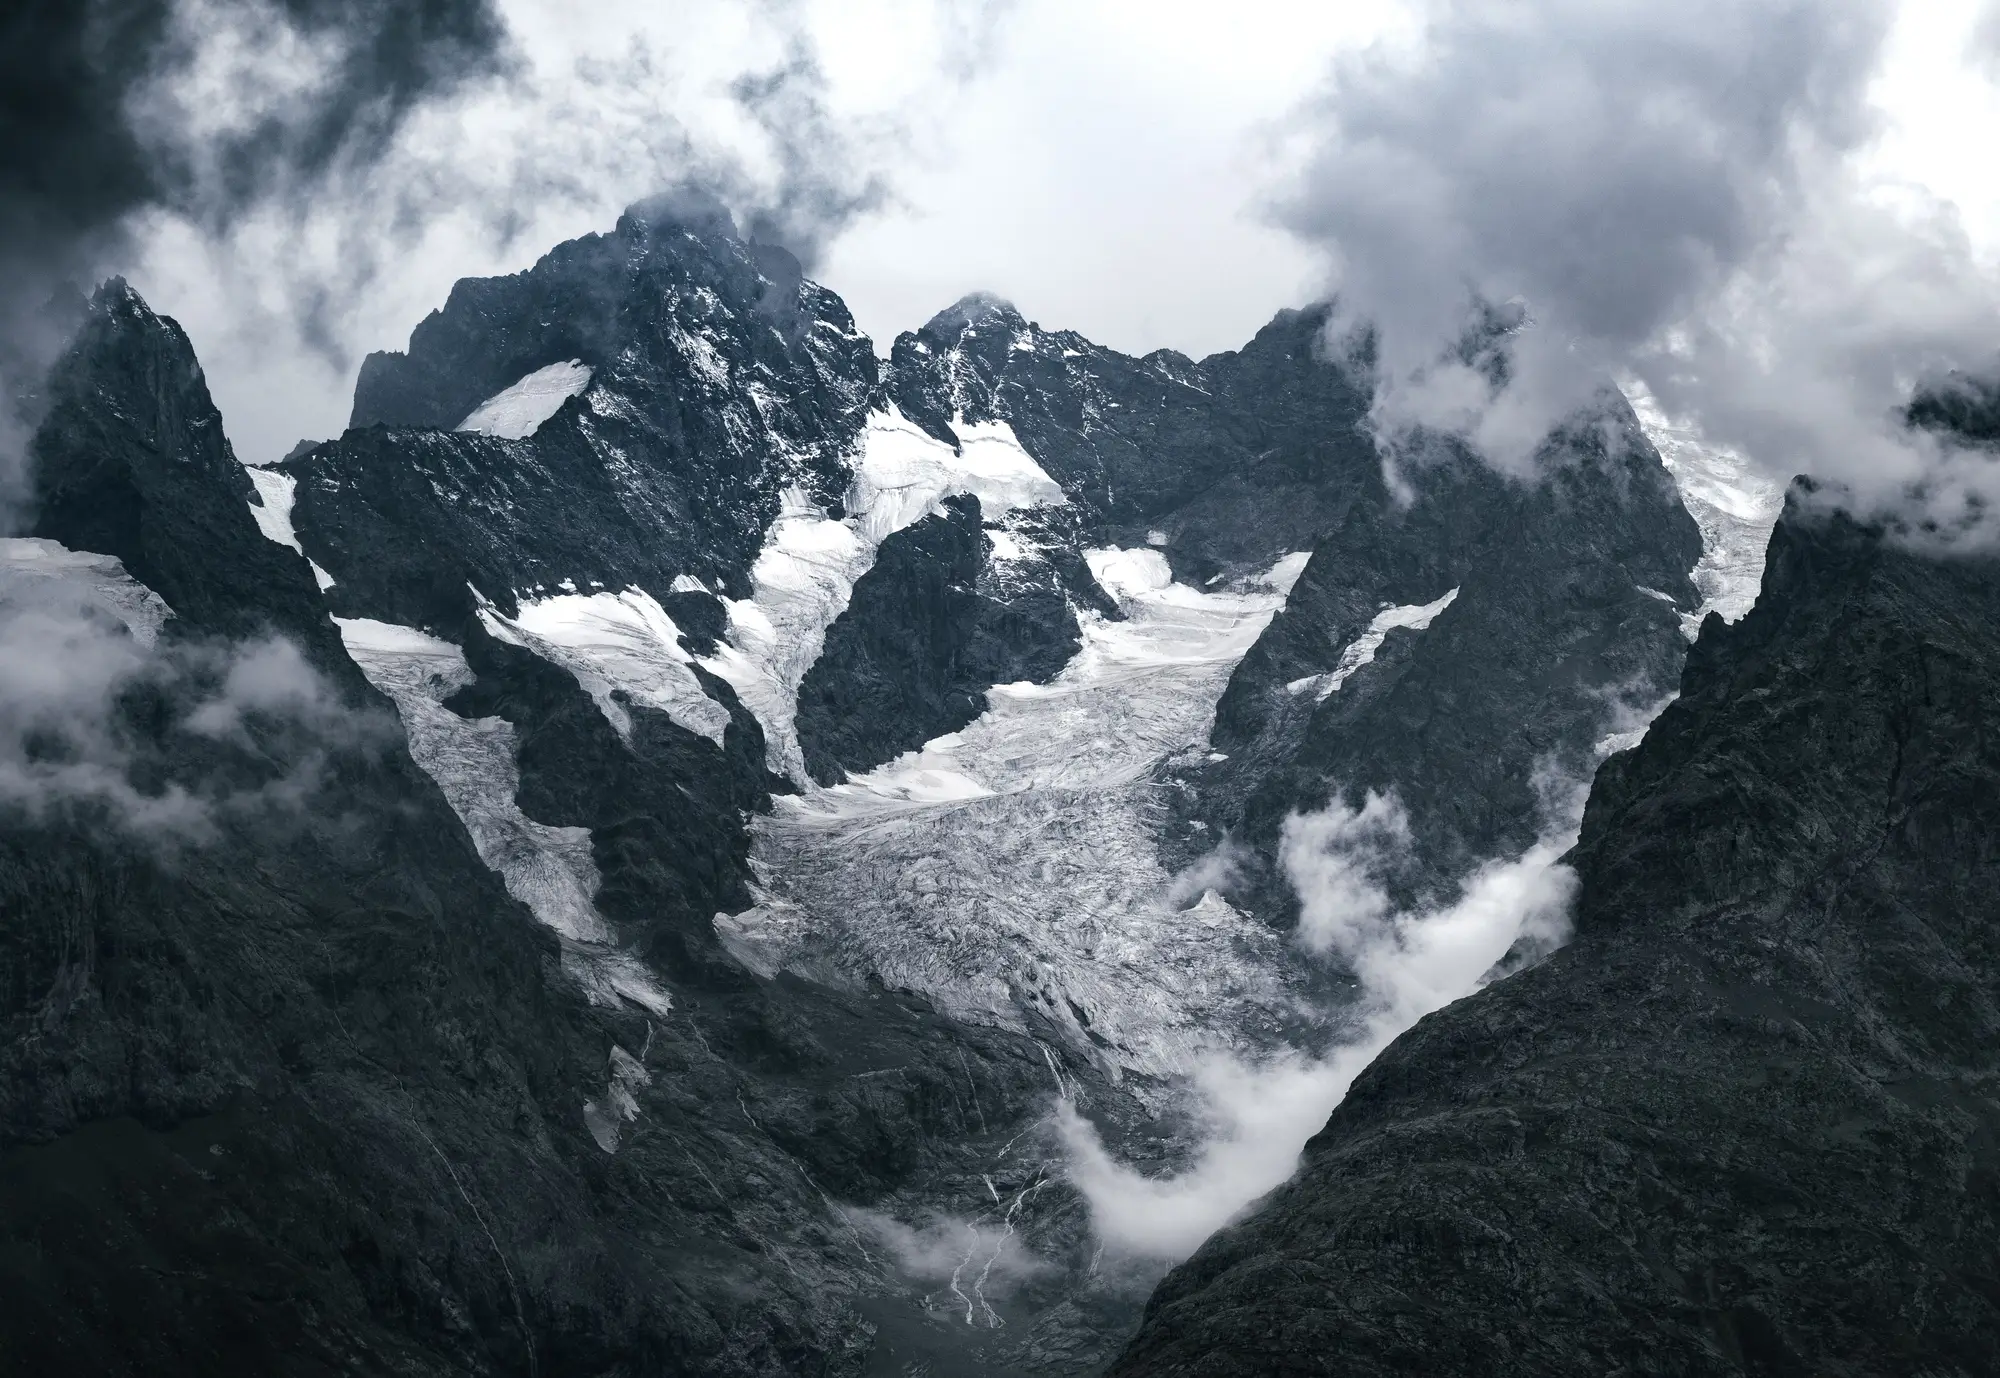
If you've spent any time setting up a glacier-fed catchment model, you've run into the Randolph Glacier Inventory. It's usually the first thing you pull in, often before you've even opened a satellite scene yourself.
The RGI is a global, publicly available dataset of glacier outlines, built and maintained by a working group of glaciologists under the umbrella of the GLIMS program. Each glacier is delineated as a polygon, usually derived from a single optical satellite image or a small cluster of images taken close together in time, then checked and cleaned up against existing regional inventories. The current version (RGI 7.0, released in 2023) covers something like 275,000 glaciers worldwide, organized into 19 first-order regions. For a lot of basins, it's the only systematic glacier outline product that exists.
What's actually in the inventory
Each RGI polygon comes with a basic attribute table: glacier ID, area, centroid coordinates, min/max/median elevation, aspect, slope, and a source date for the outline. What it does not come with, and this trips people up, is a time series. An RGI polygon is a snapshot. It represents the glacier's extent as it was mapped at one point, sometimes recent, sometimes fifteen or twenty years old depending on when clean imagery was available for that region and when that region was last revised.
That snapshot nature matters a lot for how you should and shouldn't use it. The outlines are good for telling you where ice is, or was. They're not built to tell you how fast it's going away.
How catchment hydrologists actually use it
For basin delineation, the RGI does real work. If you're setting up a hydrologic model for a catchment with glacier contribution, you need to know the ice-covered fraction of your drainage area, and you need glacier boundaries that match your DEM-derived watershed boundary closely enough to run a degree-day or energy-balance melt module without the two datasets fighting each other. Pulling RGI polygons for your basin, clipping them to your delineated catchment, and tallying ice area by elevation band is a standard first step in setting up glacio-hydrological models like those built on HBV, a distributed energy-balance scheme, or a regional climate-forced runoff model.
It's also the reference dataset most regional water agencies cite when reporting glacierized area as a percentage of total catchment area, because it's consistent across basins and reproducible by anyone who downloads the shapefile.
Where it falls short is anything involving change. If your management question is "how much has the glacier retreated since the last basin assessment" or "is the snowline creeping up in elevation year over year," the RGI alone won't answer it. A single polygon has one source date and nothing to compare it against, unless you go build a second outline yourself from a different year's imagery and difference the two. Some analysts do exactly that, hand-digitizing a terminus position from a couple of Landsat scenes to bracket a retreat estimate. It works, but it's slow, and a one-off comparison between two dates gives you two points, not a trend.
Filling the gap between inventory updates
The RGI tells you where the ice was at the inventory date. Your planning cycle runs on seasons and years, and the next global inventory revision lands on its own schedule, not yours. If you need season-by-season glacier and snowline extent for the glaciers feeding your basin, without scoping a standalone remote-sensing contract every time you need an update, that means going back into the optical archive yourself and mapping extent for each melt season.
That's the piece Glacier Monitoring is built around: a seasonal ice extent layer and a retreat time series pulled from multi-decade optical archives for the specific glaciers in your catchment, so the RGI polygon you started with becomes the baseline of an actual trend instead of the only data point you have.
If your basin assessment needs a retreat number and not just a boundary, that's worth a look.